Improvement Tracking: Mastering Continuous Progress & Results
Updated On: October 26, 2025 by  Aaron Connolly
What Is Improvement Tracking?
Improvement tracking means we keep an eye on progress—measuring and watching how changes, projects, or new ideas pan out over time.
It brings accountability, helps us spot what’s actually working, and shapes future decisions in performance, no matter the field.
Purpose and Importance
Improvement tracking gives us a map for figuring out if our changes are actually making a difference.
If we skip tracking, we’re basically flying blind.
Accountability really drives improvement tracking.
When we measure progress, people and teams start to own their results.
That kind of ownership builds a culture where everyone knows their part in making things better.
It also lets us see what’s working and what’s not.
Patterns in the numbers point out which strategies are winners.
When something fails, we get a chance to learn instead of just chalking it up as a loss.
We make resource allocation smarter too.
Tracking lets us move time, money, and effort into the stuff that actually works.
That way, we can avoid big mistakes and get more out of what we put in.
Tracking opens up clear communication across teams and organizations.
When everyone’s got the same numbers, progress talks become about facts—not just opinions.
Key Concepts and Definitions
Baseline measurement is just where we start, before any improvements.
We use this as our reference point so we can see if we’re actually moving forward.
Key Performance Indicators (KPIs) are the main numbers tied to our big goals.
These could be things like customer satisfaction, how fast we produce, or by how much we cut down errors.
Continuous monitoring means we check in on data regularly, not just at the end.
That way, we can tweak things while we’re still in the middle of making improvements.
Progress milestones break big improvement goals into smaller wins.
These little checkpoints keep teams motivated and moving.
Data collection methods really depend on what we’re tracking.
Surveys, system reports, observation checklists, or automated tools all come into play.
Improvement Tracking in Various Industries
Manufacturing depends on improvement tracking for quality and efficiency.
Companies track defects, speed, and waste to keep things running smoothly.
Healthcare uses improvement tracking for patient outcomes and safety.
Hospitals watch things like infection rates, patient satisfaction, and how quickly people recover.
Technology companies keep tabs on software performance, user engagement, and reliability.
They look at how fast they fix bugs, how many people use new features, and how quickly support answers.
Retail businesses track sales, customer loyalty, and inventory.
Metrics like conversion rates, returns, and supply chain efficiency help boost profits.
Education sectors monitor student progress and teaching quality.
Schools track test scores, graduation rates, and how engaged students are.
Core Principles of Continuous Improvement
Continuous improvement leans on structured cycles, steady testing, and a culture where everyone pitches in.
It’s not just about having a system—it’s about people actually caring about progress.
The Plan-Do-Check-Act (PDCA) Cycle
The PDCA cycle is pretty much the engine behind most improvement efforts.
We plan small changes based on what the data and our gut are telling us.
Plan: We spot problems and come up with ideas to fix them.
Teams look at how things are running and pick what to tackle first.
Do: We try out those changes, but only on a small scale at first.
Testing in a controlled space keeps the risk low.
Check: We measure if the changes did what we hoped.
Teams gather the numbers and see if things actually got better.
Act: We roll out the good changes everywhere, or we tweak the ones that missed the mark.
Then, we kick off the next round of planning.
The cycle just keeps looping, and each time around, we build on what we learned before.
It keeps everyone focused on real, measurable progress.
Building a Culture of Continuous Progress
Continuous improvement only works when everyone’s in.
We need people at every level spotting problems and tossing out ideas.
Employee empowerment starts with teaching folks to notice the small stuff that slows them down.
The people closest to the work usually see things managers miss.
Customer focus keeps us pointed in the right direction.
We go after changes that really matter to customers.
Small incremental changes are easier to handle than big, sweeping overhauls.
Teams can make little tweaks fast and see if they help.
Open communication makes it okay to share ideas—even the weird ones.
Team meetings and suggestion boxes give everyone a shot at being heard.
Recognition and rewards keep people coming back with more ideas.
We celebrate wins and even the lessons from what didn’t work.
Common Continuous Improvement Frameworks
A few frameworks help teams keep their improvement efforts on track.
Lean methodology is all about cutting waste and boosting value for customers.
Teams hunt down waste in eight different forms and get rid of it.
Six Sigma uses stats to drive down defects and make things more consistent.
It’s all about chasing near-perfect quality with data.
Kaizen is about making lots of small improvements, all the time, with everyone involved.
It started in Japan and built some pretty impressive company cultures.
Value Stream Mapping lays out every step in a process.
Teams can spot bottlenecks and delays way more easily this way.
Each framework has its own flavor, and most teams end up mixing and matching to fit what they need.
Setting and Measuring KPIs
KPIs are at the heart of any improvement tracking system.
They’ve got to match your goals and be measured regularly if you want real change.
Choosing Relevant KPIs
We start by picking metrics that actually tie to what we want to improve.
The best KPIs answer real questions about performance, not just “because we can” numbers.
Outcome-based metrics come first.
These show results, like customer satisfaction or how much we cut down errors.
Process metrics are useful too, but they come second.
When choosing KPIs, think about:
- Measurable: Can we get good data?
- Actionable: Will this number change what we do?
- Relevant: Does it connect back to our goals?
- Timely: Can we get updates often enough?
Three to five main KPIs is usually plenty.
Too many just bog everyone down.
Here’s a quick tip: pick one leading indicator (predicts what’s coming) and one lagging indicator (shows what’s already happened) for each area.
Tracking Performance Indicators
We need a system—manual or automated—to keep up with our chosen metrics.
Manual tracking can work for small teams, but bigger groups need automated tools.
Set up regular reporting cycles that make sense for your goals.
Weekly reports help with day-to-day stuff, while monthly reviews are fine for bigger-picture KPIs.
Here’s how we collect the numbers:
- Automated dashboards if you have the tech
- Manual entry for things you can’t automate
- Surveys for satisfaction scores
- Time tracking tools for efficiency
We keep all the KPI data in one spot, so nobody’s confused about which numbers are right.
Don’t change how you measure things halfway through—it’ll mess up your trends.
Aligning KPIs with Business Goals
We make sure every KPI lines up with a business goal.
That way, all our improvement efforts actually help the company, not just a random metric.
Map each KPI to a business outcome with a simple table.
For example, “response time reduction” links to “better customer satisfaction,” which ties to “higher revenue retention.”
| KPI | Business Impact | Expected Outcome |
|---|---|---|
| Error rate reduction | Quality improvement | Higher customer satisfaction |
| Process time decrease | Efficiency gain | Lower operational costs |
| Training completion | Skill development | Better service delivery |
We check this mapping every quarter.
Priorities change, so KPIs should too.
Regular chats with stakeholders keep things on track.
We ask, “Are these still the right numbers?” and “What would be more useful?”
Next step: Write down how each KPI shapes decisions, so we stay focused on actionable metrics.
Identifying Areas for Improvement
Figuring out where to focus starts with collecting smart data and looking for patterns.
We need both hard numbers and honest feedback to see what really needs fixing.
Gathering Feedback and Data
The best ideas for improvement come from lots of sources.
Start by asking the people who see the work up close every day.
Direct feedback sources are the most honest:
- Team members right there in the thick of it
- Managers who look over the results
- Customers or users who deal with the outcome
- Data from systems that track what’s happening
We can grab this info with quick surveys, one-on-ones, or simple feedback forms.
Make it easy for folks to be honest.
Performance data shows us what’s really happening:
- How long tasks take
- Error rates or quality scores
- Customer satisfaction ratings
- Output or productivity numbers
These numbers tell us exactly where things break down.
It takes the guesswork out and points us to the real issues.
Analysing Trends and Gaps
Once we have feedback and data, we look for patterns.
Look for recurring themes in what people say and in the numbers:
- Problems that pop up in different places
- Metrics that keep missing the mark
- Issues that show up at certain times or steps
- Skills gaps that more than one person mentions
Charts or simple lists can help spot these patterns fast.
If a problem shows up in both feedback and performance data, we know it’s a big deal.
Compare where we are to where we want to be:
- Where are we missing our targets?
- Which spots have the biggest gaps?
- What fixes would make the most difference?
The biggest gaps between now and our goals become our priority list.
We can rank them by what would help the most if we fixed them.
Documenting and Implementing Corrective Actions

When things go wrong in competitive gaming operations, documenting the problem creates a clear path to fixing it.
Building solid action plans makes sure we actually solve problems—and don’t just let them happen again.
Reporting Non-Conformances
Reporting problems the right way helps teams keep track of what’s going wrong and why.
Start by writing down exactly what happened, when, and who got hit by it.
Key details to include:
- Date and time of the issue
- People involved or affected
- Equipment or systems that had trouble
- What happened as a result
Keep problem statements specific.
Instead of “stream quality was bad,” write “stream dropped to 480p during peak viewership from 7-8 PM, affecting 2,500 viewers.”
Grab evidence right away—screenshots, logs, or what people saw.
This stuff matters when you’re digging for the real cause later.
Documentation should answer:
- What exactly went wrong?
- Where did it happen?
- How bad was it?
- What did we do right after?
Get reports in fast.
Details are clearer when they’re fresh.
Creating Effective Action Plans
Action plans take problems and turn them into real fixes.
We go after the root cause, not just the symptoms, so the issue doesn’t come back.
What every plan needs:
- Specific actions to take
- Who’s responsible for each task
- When it should be done
- How we’ll know it worked
Give each action an owner.
When someone’s in charge, things actually get done.
Set realistic deadlines based on how tough the fix is and who’s available.
SMART criteria help:
- Specific – Instead of “improve communication,” try “set up daily team check-ins”
- Measurable – Use numbers, like “keep stream downtime under 2 minutes”
- Achievable – Be honest about what’s possible
- Relevant – Make sure it solves the real problem
- Time-bound – Put a date on it
Build in checkpoints to track progress.
Regular reviews catch problems early and let us adjust if we need to.
That keeps corrective actions from turning into new headaches.
Monitoring Improvement Progress

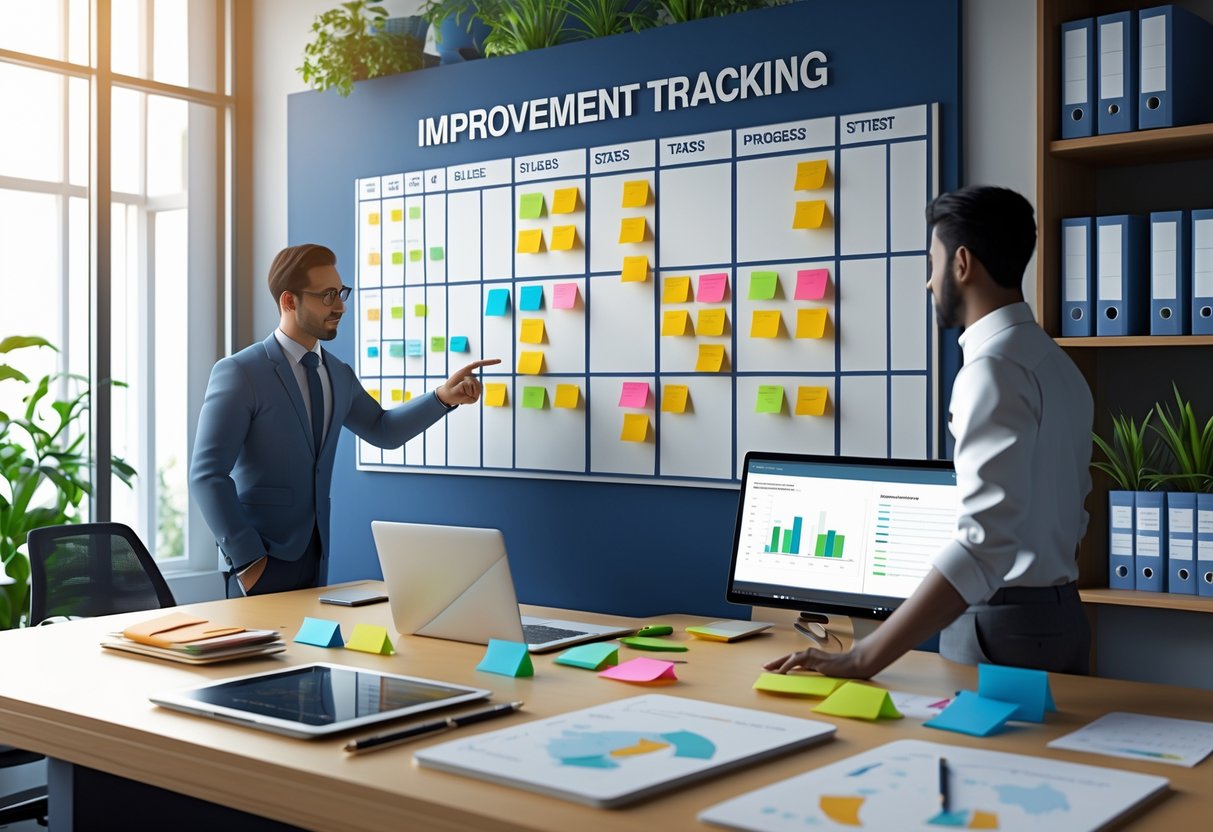
If you want to keep a project moving, you’ve got to track tasks systematically and use visual systems that show progress at a glance. These two methods help teams stay on the same page.
Tracking Task Status and Responsibilities
We need to know who’s handling each task and when it gets done. That’s how we keep people accountable and make sure nothing slips through.
Task assignment boards help a lot with this. Digital boards like Trello or simple Kanban boards show where every task stands—planned, in progress, or finished.
Each task needs a clear owner. Someone should always be responsible for getting it done.
Deadlines should be visible to everyone. No secrets.
Update progress regularly so nobody’s left guessing.
Regular check-ins catch problems early. Weekly meetings to review progress keep things from getting stuck.
Team members can flag obstacles and ask for help right away.
Status reporting keeps everyone in the loop. A simple traffic light system—red, amber, green—lets people know if things are on track or need attention.
Visual Management Tools
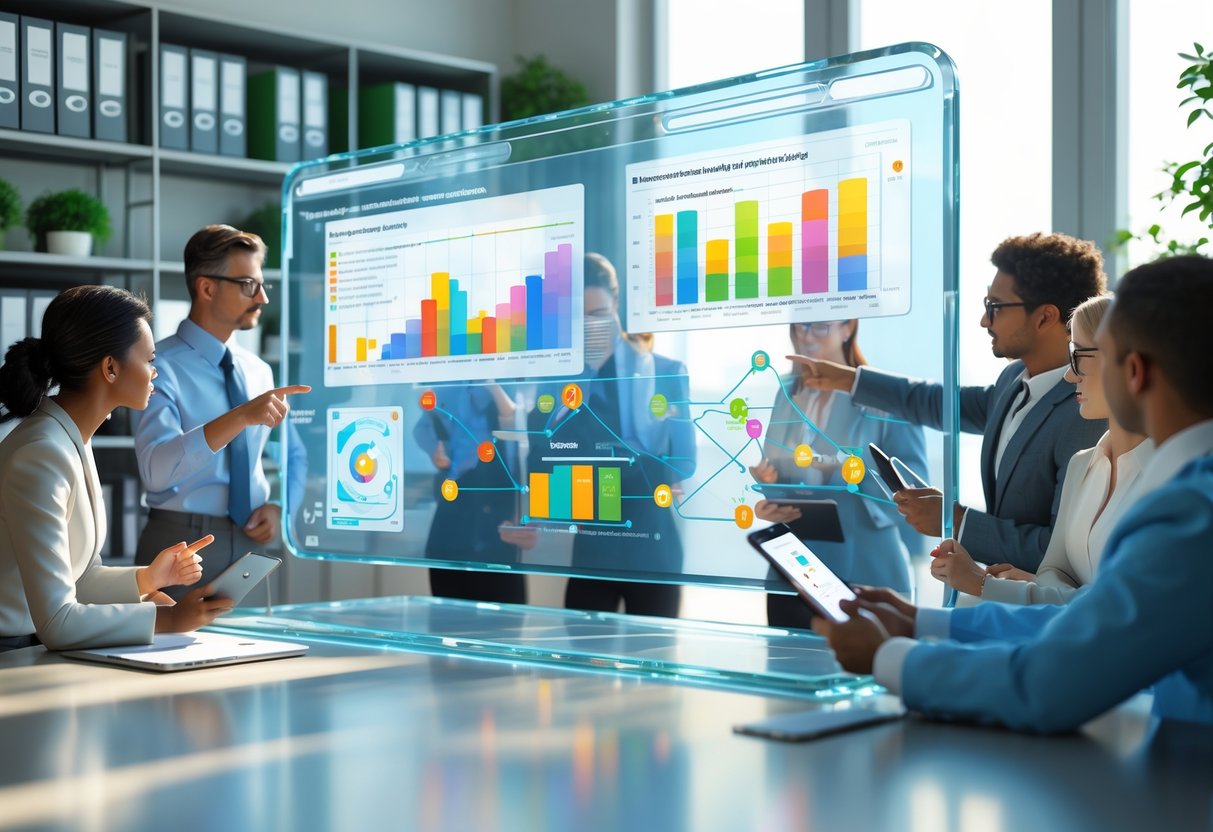
Visual tools make it obvious where things stand. They turn complicated data into something you can actually use.
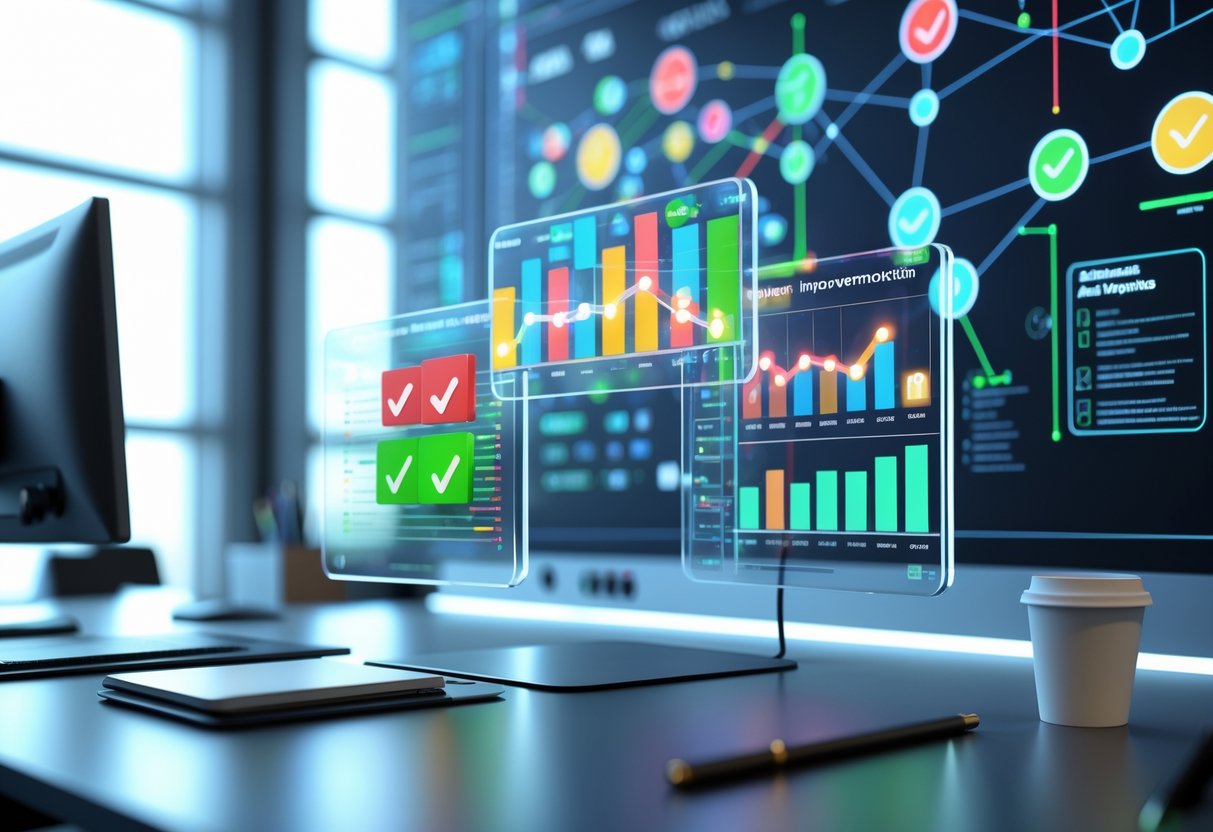
Progress boards show key metrics and milestones in a visual way. They can display completion percentages, timelines, or quality measures using charts and graphs.
Dashboard systems bring all the important numbers into one view. They track things like cost savings, error rates, or customer satisfaction scores right alongside your project timeline.
Colour-coded systems let you spot issues fast. Red means trouble, green means all good.
Physical displays—like wall charts or digital screens—keep everyone aware of progress and targets.
These tools work best when you update them often and put them somewhere everyone can see during their daily work.
Continuous Improvement Tools and Software

Modern improvement software helps teams track progress, collect ideas, and manage changes all in one spot. These platforms come with customizable dashboards, integration options, and collaboration features that really change how organizations handle improvement tracking.
Popular Improvement Tracking Platforms
A handful of platforms stand out in the improvement software world. Each one brings something different to the table.
Impruver lets you build custom tools or pick from ready-made options. It offers KATA storyboards, gamification, and detailed reporting. Prices go from free up to £4 per user monthly.
KaiNexus is all about Kaizen. It gathers improvement ideas, tracks metrics, and creates a knowledge base. The platform supports both small daily changes and bigger Kaizen events.
Reverscore uses AI to bring insights to frontline operations. It has guided workflows, digital checklists, and task management. One company saved £48,000 with 28 ideas implemented through this platform.
The Lean Way offers a Pinterest-style board for improvements. Teams can pin ideas, share updates, and see progress in a more visual way.
Features to Look For
Some features really make a difference in improvement tracking. They help keep people engaged and deliver real results.
Idea collection systems should let everyone pitch in. Voting, categories, and approval workflows make it easy to sort and act on ideas.
Progress tracking dashboards give you a real-time look at how things are going. The best ones let you customize metrics, automate reports, and show visual progress.
Collaboration tools allow teams to work together across departments. Things like commenting, file sharing, and shared boards keep projects moving.
Mobile accessibility is a must for teams on the go. Many frontline workers use their phones for everything.
Gamification elements make things more fun. Points, leaderboards, and badges turn tracking into a friendly competition instead of just another task.
Customisation and Integration Options
Flexibility matters. Good improvement software adapts to your process, not the other way around.
Custom form builders let you create templates for improvement requests. Every department can set up their own fields and approval steps.
Integration capabilities connect your improvement tracking to other business tools. You can link project management, communication platforms, or analytics software.
Reporting customisation helps you focus on the metrics that matter for your team. Build dashboards for departments or execs using the same data.
Workflow automation cuts down on busywork. Automatic notifications, approvals, and progress updates keep things moving without manual checks.
API access lets bigger organizations connect with legacy systems or build custom reports. Handy if you’ve got compliance needs or unique requirements.
Using Boards for Tracking Improvements
Boards help teams see their progress and stay organized. You can use digital tools or stick with physical boards, depending on what works for your group.
Digital Boards vs. Physical Boards
Digital boards give you flexibility and remote access that physical boards just can’t. Tools like Trello, Asana, or specialized software let you update progress from anywhere.
You can attach files, set reminders, and pull reports with a few clicks.
Digital Board Benefits:
- Real-time updates for remote teams
- Automatic progress tracking
- Easy to back up and share data
- Good for teams in different locations
Physical boards work best for teams in the same space every day. Whiteboards, magnetic boards, or cork boards give you a spot everyone can see.
Team members just update tasks with sticky notes or markers—no logins needed.
Physical Board Benefits:
- Always visible to the team
- No tech headaches
- Encourages face-to-face chats
- Simple for everyone to use
Pick what fits your team. Some groups use both: digital for remote work, physical for the office.
Setting Up Effective Tracking Boards
Divide your board into clear sections that match your process. Four columns usually work: To Do, In Progress, Review, and Complete.
Essential Board Elements:
- Clear, specific problem statements
- Assigned team members
- Target completion dates
- Progress markers or status updates
Make each improvement easy to spot with key details. Write the problem, owner, and due date. Colour code for priority or type.
Update your board often. Weekly reviews help you move items along and talk about any blockers.
Keep completed items visible for a couple of weeks to celebrate. Then archive them to make space for new work and keep a record of wins.
Reviewing and Auditing Improvements
Regular reviews and audits turn improvement tracking into something that actually helps. We need real-time data and clear accountability to spot what’s working and fix what isn’t.
Real-Time Reporting and Analytics
Real-time reporting lets us catch problems before they get out of hand. Instead of waiting for monthly reports, we can track key metrics as they happen.
Dashboard essentials should focus on the numbers that matter. We usually track response times, completion rates, or quality scores—just a few that connect directly to our goals.
Modern tools make it easier than ever:
| Tool Type | Best For | Typical Cost |
|---|---|---|
| Project management software | Task completion rates | £10-50/month |
| Analytics dashboards | Performance KPIs | £20-100/month |
| Automated reporting | Progress summaries | £15-75/month |
Setting up alerts helps us react fast when things slip. Notifications pop up when metrics drop below target, so we can fix issues early.
The data reveals patterns you might not notice otherwise. Sometimes improvements work best at certain times or with certain teams.
Ensuring Accountability and Transparency
Accountability makes improvements real. When everyone knows their role and how we measure success, things actually get done.
Clear ownership means we assign specific people to each improvement. No more “the team will handle it”—we name names.
Short, weekly check-ins keep people focused. Fifteen minutes a week beats an hour once a month. We talk about what’s working and what needs to change.
Transparent reporting builds trust. When we share both wins and failures, people feel more invested.
Simple progress tracking helps:
- Green: On track
- Amber: A little behind, but fixable
- Red: Needs attention now
This system lets everyone see status at a glance. People can connect their work to bigger goals and celebrate together.
Encouraging Team Engagement in Improvement Tracking

Getting your team involved in tracking improvements takes clear ways to share ideas and systems that keep everyone motivated. When team members see their input matters and watch their ideas drive change, they naturally become champions of the process.
Capturing Suggestions and Feedback
We need simple ways for people to share ideas as we go. Set up multiple feedback channels so everyone can contribute—through meetings, digital suggestion boxes, or just chatting one-on-one.
Hold regular feedback sessions to review current metrics together. These meetings help you spot gaps that numbers alone might miss.
If the metrics look good but people feel overwhelmed, it’s time to tweak the approach.
Make feedback actionable by sorting suggestions by impact and effort. Use a basic scoring system to decide what to tackle first.
When team members see their ideas put into action, they’ll keep sharing.
Document all feedback in your tracking system. This shows everyone their input counts and makes it easy to look back later.
Motivating Participation Across Teams
Recognition keeps people engaged. Celebrate both small wins and big achievements so everyone sees their efforts matter.
Share progress updates often so teams know how their work fits into the bigger picture.
Create friendly competition by tracking improvement metrics openly. Use visual dashboards to show each team’s progress, but don’t create unnecessary pressure.
Teams often work harder when they see where they stand.
Rotate tracking responsibilities so different people take turns leading. This way, tracking doesn’t fall on just one person and everyone learns the ropes.
Tie improvement tracking to professional growth. When people see that participating helps them build skills, they’re more likely to stay involved.
Best Practices for Sustaining Improvement Initiatives
Keeping improvements going long-term means regular check-ins and smart ways to spread success across the organization. We need systems that can handle change and ways to share what works everywhere it’s needed.
Continuous Evaluation and Adaptation
Regular monitoring keeps things on track, even when circumstances shift. Check your progress every month using simple metrics that everyone understands.
Hold monthly review meetings to see what’s working. Use basic charts to show if things are improving or not.
This helps you catch issues before they get out of hand.
Set up a quick feedback system so staff can report problems right away. Many improvements fail because people see issues but don’t know how to speak up.
Track three things:
- Are we still doing the new process right?
- Are the results holding steady?
- What new problems have popped up?
When something stops working, fix it quickly. Don’t wait for a big review.
Small fixes now stop bigger headaches later.
Change your approach if needed. If something works in winter but not summer, adjust it. Real improvement means staying flexible without losing the benefits.
Scaling Improvements Across the Organisation
Moving successful improvements to other departments takes more than just copying what worked elsewhere. Every area has its quirks and different needs.
Try pilot testing in departments that share similar challenges. Pick spots where managers are on board and the problems look familiar. This way, you can work out the kinks before rolling things out everywhere.
Put together simple training materials that any team can actually use. Focus on step-by-step guides and fixes for common issues. Skip the jargon—plain language works best.
Offer real support to new areas during those first three months. Have someone from the team that nailed it the first time stick around to answer questions and help troubleshoot.
Set up regular check-ins for departments using the same improvements. Let them swap tips and talk through problems together. That way, you end up with a helpful network across your organisation.
Use consistent metrics to measure success everywhere. When you track the same things, it’s easier to compare departments and see what’s working—or what needs a rethink.
Frequently Asked Questions

These questions come up all the time about improvement tracking. Setting up Excel systems, picking the right KPIs, or building dashboards that teams actually use—honestly, most organisations run into the same headaches when they start tracking progress.
How can I set up a successful continuous improvement tracking system using Excel?
Kick things off with a basic spreadsheet. Track project name, target date, and current status in three columns.
Add a fourth column for who’s responsible, and a fifth for any roadblocks.
Use Excel’s filters to sort by status or deadline. That way, you’ll spot which improvements need attention fast.
Create different tabs for different types of improvements. Maybe one for cost-saving projects and another for quality boosts.
Set up conditional formatting. Overdue items show up in red, completed ones in green. It’s a quick visual cue during meetings.
Update your Excel tracker once a week. Updating daily just creates busywork and doesn’t help much.
Could you suggest an effective template for monitoring process enhancements?
A solid template starts with project details: name, owner, start date, and expected finish.
List out key milestones underneath, with target and actual completion dates.
Include a section for measuring results. Jot down baseline numbers, your targets, and what actually happened when the project wrapped up.
Leave space for regular updates. Lots of teams use a traffic light system: green for on track, yellow for minor bumps, red for major trouble.
Add a lessons learned section at the bottom. It helps future projects dodge the same mistakes and build on what worked.
Keep it to one page if you can. Nobody wants to update a monster template every week.
What are some exemplar KPIs to consider for ongoing enhancement tracking?
Count how many improvement ideas your team submits each month. It’s a good sign of engagement.
Track what percentage of improvements finish on time. Hitting at least 80% keeps things moving.
Measure cost savings from completed projects. Turn time saved into money by using your team’s average hourly wage.
See how many team members take part in improvement activities every quarter. Look for trends—are more people getting involved, or less?
Track the average time from idea submission to implementation. The faster you make changes, the more likely people will keep suggesting new ideas.
What elements should be included in a comprehensive improvement report?
Begin with a summary of completed improvements and their results. Use real numbers, like “cut processing time by 15 minutes per order.”
Show ongoing projects and their status. Make it clear which ones are on track and which need a push.
Share financial results from improvements. Break out cost savings, revenue gains, and what you spent to get there.
Add team engagement stats. How many people suggested ideas, joined meetings, or finished training?
Wrap up with next quarter’s priorities and what resources you’ll need. Leadership needs to know what kind of support you’re asking for.
Which features are essential to include in a continuous improvement roadmap template?
Lay out clear timeframes for each initiative. Go with quarters instead of exact months to keep things flexible.
Map dependencies so you know which projects need to finish before others can start. It saves you from resource clashes and delays.
List resource needs for each initiative. Include both people and budget so leadership can plan ahead.
Add review points every three months. These checkpoints let you adjust the plan if priorities shift or new opportunities pop up.
Group improvements by type. Keep quick wins separate from bigger, long-term changes.
Can you guide me through designing a user-friendly dashboard for tracking improvement metrics?
Pick no more than six key metrics for your main dashboard. When there are too many numbers, users get overwhelmed and might tune out.
Stick with simple charts, like bar graphs or line charts. Your team should be able to glance at the data and get it right away.
Add trend lines to show progress over time. These lines help everyone spot patterns and maybe even guess what’s coming next.
Use colour coding that matches what your organisation already uses. If your team relies on red, yellow, and green for status, keep those colours.
Make sure the dashboard works well on mobile devices. Managers often check metrics on the go, especially during site visits or meetings.
Update the dashboard every week with new data. When info gets stale, people stop trusting it—and honestly, they just stop checking.