Enforcement Disparities: Understanding Causes, Impacts, and Solutions
Updated On: November 13, 2025 by Aaron Connolly
Defining Enforcement Disparities
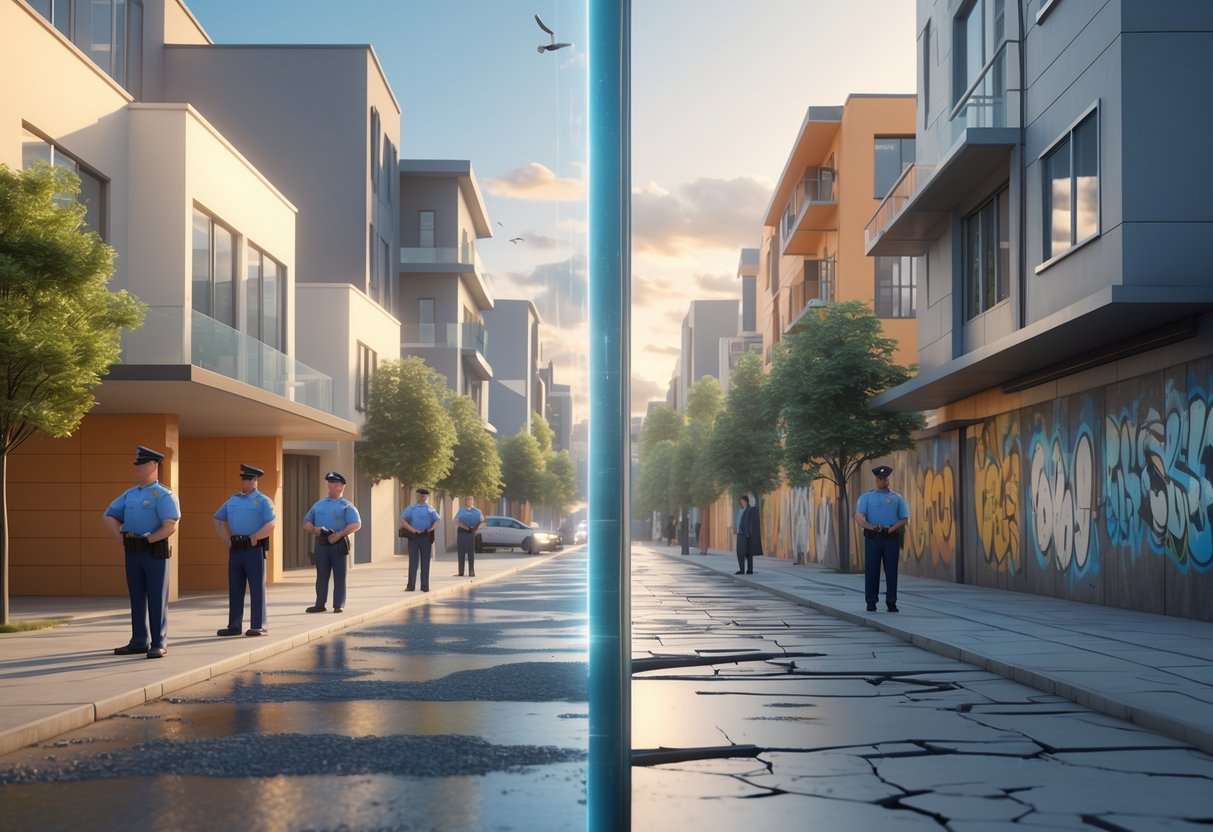
Enforcement disparities happen when police treat people from different racial or ethnic backgrounds unequally during stops, searches, arrests, or use of force. These differences usually grow out of systemic issues, not because of actual differences in crime, and they shape how the justice system works in different neighborhoods.
What Are Enforcement Disparities?
Enforcement disparities basically mean police act differently based on someone’s race or ethnicity. You see this in things like traffic stops, arrests, and how much force officers use.
Researchers have found that Black and Hispanic people run into police at much higher rates than white people. They’re 50% more likely to have force used against them during these encounters.
The numbers don’t match up with real differences in crime. Instead, these gaps often come from biased policing and the way neighborhoods are policed.
Drug enforcement really highlights this problem. Federal surveys say white, Black, and Hispanic people use illegal drugs at almost the same rates. But police arrest these groups at wildly different rates.
You can spot these patterns throughout the justice system. From that first police encounter all the way to court, minorities get different treatment.
Types of Disparities in Law Enforcement
A few areas really stand out when you look at racial and ethnic gaps in policing:
Traffic Stops and Searches
Police pull over Black and Hispanic drivers more often than white drivers. When they do, officers search cars driven by minorities at higher rates, even though they find contraband at about the same rate across groups.
Use of Force Incidents
Officers use force more on Black and Hispanic civilians. Studies in a dozen law enforcement agencies show the same racial gaps as national reports.
Drug-Related Enforcement
Even though drug use rates are similar, minorities get arrested for drug offenses more often. Lower-level enforcement creates long-term problems and widens racial gaps.
Geographic Targeting
Police send more officers into minority neighborhoods. Areas with more Black and Hispanic residents get heavier police presence and tougher tactics.
Quality-of-Life Policing
Suburban communities really show the difference. Black people get arrested 4.5 times more often than white people for quality-of-life offenses there.
Measuring Disparities and Key Indicators
Researchers use a few main ways to spot and measure these disparities:
Population-Adjusted Rates
Raw numbers can be misleading. Analysts look at per capita rates to see the real gaps between groups.
Statistical Analysis Techniques
Researchers dig through big datasets of police stops. They control for location, time, and alleged offense to find patterns that single cases might hide.
Key Measurement Areas
- Stop rates by race
- Search rates during traffic stops
- Arrest rates for similar crimes
- Use of force incidents per capita
- Differences in case outcomes and sentencing
Data Collection Challenges
A lot of datasets just aren’t complete. Studies show 29% or more of records are missing race or ethnicity info, especially for non-white people.
Police, courts, and research groups all track different things. This makes it tough to get a full picture across different places.
Geography adds another layer. Urban, suburban, and rural areas each show their own patterns, so you really have to analyze them separately.
Historical Roots of Disparities
Law enforcement disparities trace back to centuries-old systems that built racial discrimination into policing structures. The roots go deep, starting with slave patrols and running through Jim Crow laws, which left behind institutional biases that still shape policing.
The Legacy of Structural Racism in Policing
American policing grew along two paths, but both ended up reinforcing racial inequality. In the South, slave patrols kicked off law enforcement in the early 1700s.
White volunteers ran these patrols. They entered homes without permission, hunted escaped enslaved people, and put down uprisings. By the time John Adams was president, every slave-holding state had them.
Up north, cities built police forces in the 1800s. These departments were almost all white men. Their main job? Controlling what officials called the “dangerous underclass.”
Key targets included:
- African Americans
- Immigrants
- Poor residents
Early police forces didn’t really have hiring standards or much training. Violence against vulnerable groups was common, and nobody held officers accountable. That attitude stuck around in police culture.
Even Black officers weren’t treated fairly. Departments usually assigned them only to Black neighborhoods and blocked them from promotions.
Evolution of Discrimination in Law Enforcement
After the Civil War, officials disbanded slave patrols. But new laws quickly filled the gap to keep racial control in place.
Black Codes showed up right after slavery ended. These laws controlled where African Americans could work, travel, and live. They also limited voting and set wages.
The 14th Amendment outlawed Black Codes in 1868. But then Jim Crow laws took over in the South—and even some Northern states.
For about 80 years, Jim Crow forced separation in public spaces. Police enforced these rules as part of their regular jobs.
Jim Crow enforcement included:
- Separating schools and libraries
- Controlling who could use water fountains
- Monitoring restaurant segregation
- Punishing people for breaking social rules
Black people who broke these laws often faced police violence. Lynch mobs killed African Americans, and police rarely stepped in. The courts didn’t hold officers responsible for failing to protect victims.
Key Historical Examples Affecting Policy
Modern policing still carries these historical patterns, even after civil rights reforms. Data keeps showing racial gaps in police interactions.
Traffic stops are a good example. Stanford University looked at almost 100 million traffic stops from 2011 to 2017. They found Black drivers were stopped more and searched more than white drivers.
The research found:
- Police pulled over Black drivers more often
- They searched Black drivers’ cars at higher rates
- Stops dropped after dark, when skin color was harder to see
Fatal police encounters show the same pattern. In 2018, Black Americans made up 23% of people killed by police, but only 12% of the population.
Some departments have started bias training. Criminal justice students now take diversity classes to recognize their own prejudices. New York City and other places train officers to avoid discriminatory practices.
Still, structural racism is baked into policing. Without facing these historical roots, departments will probably keep making the same mistakes. That stops police from serving everyone equally.
Racial Disparities in Policing Practices
Researchers have found Black residents get stopped by police at more than twice their share of the population. Officers stop 21% of Black residents for reasonable suspicion compared to just 12% of white residents.
These patterns keep showing up in both traffic stops and pedestrian encounters.
Racially Disparate Policing Tactics
Police use different tactics depending on the race of the person they’re dealing with. In California, officers search Black people in 20% of stops, but search white people in only 8% of stops.
Even with higher search rates, officers don’t find more contraband when searching Black individuals. Success rates are about 21% across groups. That makes you wonder if officers have good reason for all those extra searches.
Other patterns stand out:
- Police arrest Black individuals almost twice as often
- Officers book them into jail 1.8 times more frequently
- Black residents get stopped for outstanding warrants at double the rate (1.2% vs 0.6%)
Officers say they use reasonable suspicion to stop Black residents in 21% of cases. For white residents, it’s just 11.7%.
Disproportionate Police Stops by Race
Traffic stop data paints a pretty clear picture. Black residents make up 7% of California’s population but account for 16% of all police stops.
Middle Eastern and South Asian people also get stopped more than their numbers suggest—5% of stops, but only 2% of the population. Pacific Islanders see similar overrepresentation.
Here’s how the stop rates break down:
| Race/Ethnicity | Population Share | Stop Share | Ratio |
|---|---|---|---|
| Black | 7% | 16% | 2.3x |
| White | 34% | 33% | 1.0x |
| Latino | 41% | 39% | 0.95x |
| Asian | 12% | 6% | 0.5x |
White and Latino residents get stopped at rates close to their share of the population. Asian residents get stopped much less often than their numbers would predict.
Patterns in Traffic and Pedestrian Stops
Traffic violations make up different percentages of stops for different groups. Over 90% of Asian residents’ stops are for traffic issues, but only 75% of Black residents’ stops are for traffic.
Officers cite parole or probation status twice as often when stopping Black individuals compared to white residents.
Force escalates more often in stops involving Black residents:
- Officers ask them to exit the vehicle in 17% of stops
- Physical contact happens in 14% of encounters
- Police use handcuffs in 8% of stops
- Weapons come into play in 0.42% of cases
Surveys show just 33% of Black adults think police use force appropriately, while 75% of white adults say the same. There’s a similar gap in how groups view equal treatment.
Officers report using weapons in nearly 2,000 stops each year. These incidents mostly involve residents of color, though the details are still a bit fuzzy.
Understanding Racial Bias in Enforcement
Racial bias in law enforcement creeps in through both conscious and unconscious processes. These biases affect how officers make decisions. Studies keep finding disparities in stops, searches, and use of force—even after accounting for local crime rates and demographics.
Implicit and Explicit Bias in Policing
Implicit bias is the stuff we’re not aware of—attitudes that shape behavior without us realizing. Police officers, like everyone else, have these hidden preferences that can sway their split-second choices.
Researchers have shown officers demonstrate implicit bias in lab settings. The “shooter bias” studies show people—including police—make faster decisions to “shoot” when targets appear Black instead of white.
Explicit bias is more conscious. Overt racism has dropped, but studies still show some officers hold beliefs that link race to crime.
Social psychologists point to a few key mechanisms:
- Race-crime stereotypes that tie Black people to danger
- Ingroup favoritism where officers prefer their own group
- Dehumanization that makes some groups seem less human
These biases pop up in real police decisions. Officers might see the same behavior as more threatening if a Black person does it versus a white person.
Outcome Tests for Discrimination
Researchers use outcome tests to spot racial discrimination in police data. They look at whether police treat people differently by race after accounting for other factors.
Traffic stop analysis shows big disparities. Black and Latino drivers get stopped more than white drivers, especially during the day when officers can see race more easily.
“Veil of darkness” studies compare stop rates in daylight and darkness. If bias is at play, racial gaps shrink after dark when officers can’t see race as clearly.
Search and hit rates offer more clues. If officers search Black drivers more but find less contraband, it suggests a lower bar for searching minorities.
Use of force data keeps showing gaps. Studies in several police departments found Black people experience force more often than white people, even after controlling for arrest rates and local demographics.
These outcome tests give us objective evidence of different treatment, while still accounting for real factors like crime patterns.
Social Psychology and Police Behaviour
Social psychology research sheds light on how everyday thinking shapes biased policing. Stereotype threat doesn’t just affect civilians—it gets to officers too during tense encounters.
Officers sometimes feel anxious when working across racial lines. That anxiety can make them more defensive or even aggressive, which just ramps up the tension.
Automatic processing kicks in when officers have to make split-second decisions under stress. They fall back on mental shortcuts, and unfortunately, racial stereotypes can slip in.
Researchers have noticed officers change how they talk depending on a suspect’s race. Body camera footage shows officers speak less respectfully to Black people than to white folks during routine stops.
Phenotypic bias is another factor. People with more stereotypically Black features often get treated more harshly, regardless of their actual race. So bias isn’t just about categories—it’s about appearances too.
Departments have tried training programs to tackle these psychological issues. But evidence is all over the place when it comes to whether implicit bias training really changes what happens out on the street.
The most promising fixes seem to be procedural changes. Things like body cameras, new policies, and accountability measures look like they could actually reduce biased outcomes.
Research and Data on Disparities
Researchers today rely on huge datasets that track millions of police interactions. They use advanced statistics to spot patterns, and body cameras now offer hard evidence. New techniques help measure bias and show how communities really experience policing.
Statistical Analysis Methods
Statistical analysis now sits at the heart of understanding enforcement disparities. Researchers dig into data from nearly 100 million traffic stops to see how things break down across different groups.
The standard method compares who gets stopped to the local population. In California, for example, Black residents make up 16% of stops but just 6% of the population. That’s a big gap.
Researchers use several advanced tools:
- Outcome tests to compare how often searches actually find something
- Benchmarking against population data
- Regression models that factor in location and timing
Search yield analysis stands out. If searches of Black civilians turn up less contraband than searches of white civilians, it points to different standards being used.
Modern studies look at outcomes like use of force, search rates, and who gets booked. Statistical models help tease apart what’s due to legitimate factors versus what’s just bias.
Use of Body Camera Footage
Body camera footage gives researchers a clear look at police interactions—something they never had before. Cameras show what really happens during stops.
Footage lets people check if police reports line up with reality. It shows whether officers followed the rules and how they treated different groups.
Researchers use this footage to:
- Compare officer behavior with various demographics
- Document how situations escalate
- Analyze both what’s said and what’s done physically
Footage provides context that raw numbers just can’t. For example, cameras catch whether officers use different tones or approaches with different people.
Some teams even train AI to spot patterns in thousands of hours of footage. That’s something humans just can’t do at scale.
Role of Researchers in Uncovering Disparities
Researchers from universities, think tanks, and advocacy groups have driven the effort to document enforcement disparities through careful data work.
Academic teams often work directly with police departments to dig into internal data. These partnerships reveal patterns that might go unnoticed otherwise.
The Research Network on Misdemeanor Justice, launched in 2016, zeroes in on low-level enforcement. These are the most common ways police interact with communities.
Researchers contribute by:
- Inventing new ways to measure bias
- Standardizing metrics across departments
- Publishing peer-reviewed studies on enforcement patterns
Independent groups like the Center for Policing Equity team up with law enforcement to assess their data. They’ve put out dozens of local reports on disparities.
Researchers also check if interventions like implicit bias training actually work, helping sort out which reforms matter.
Impact of Disparities on Communities
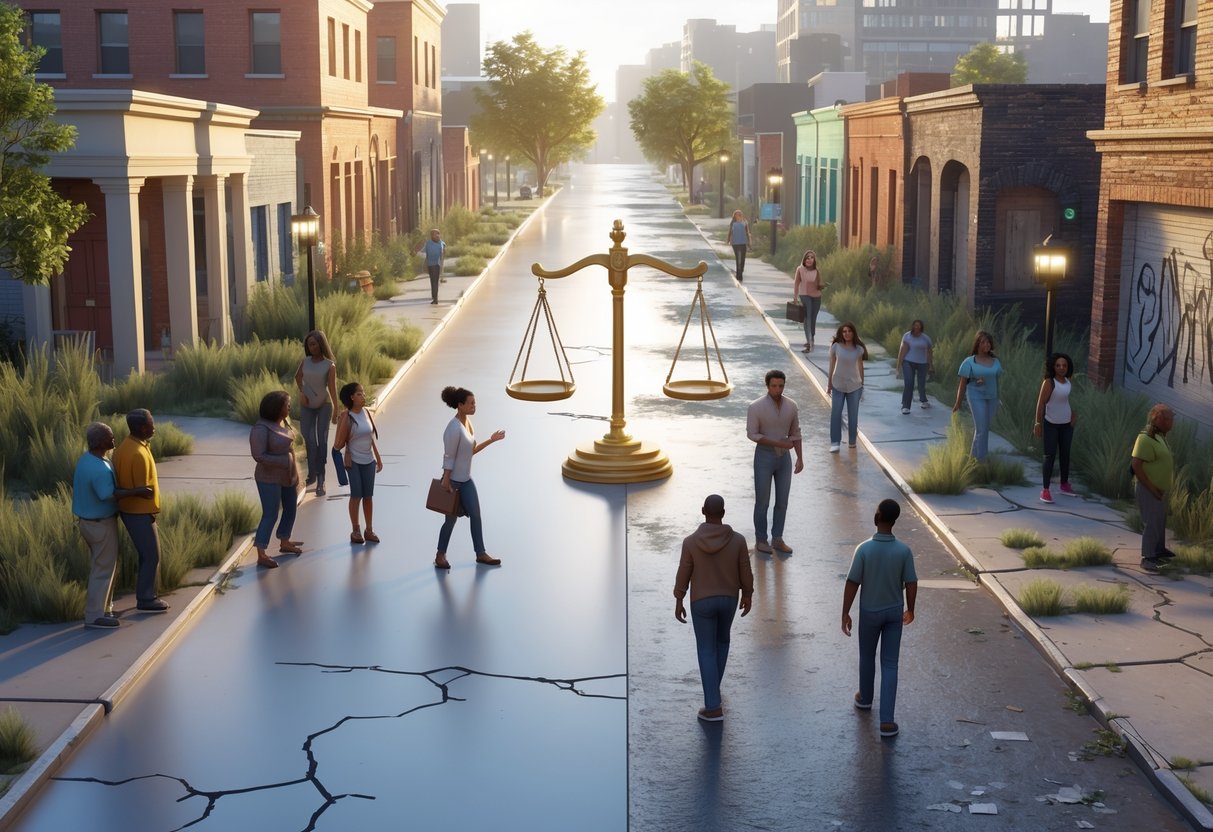
Enforcement disparities cut deep, wounding entire communities—not just individuals. These gaps erode trust between police and residents, fuel social movements, and shape public opinion through media coverage.
Victimisation and Community Trust
When police stop and search Black drivers more often than white drivers, the whole community feels it. Studies show that communities hit hardest by biased policing feel less safe, not more secure.
Trust erodes in a few key ways:
- People avoid calling the police, even when they need help
- Young folks start seeing officers as threats, not protectors
Families teach their kids to be wary of law enforcement instead of respecting them. When trust drops, cooperation with investigations dries up.
The impact spreads beyond just those stopped. If one family member faces unfair treatment, everyone in the household loses faith. Neighbors hear the stories and often have their own.
Black communities bear the brunt of these disparities. Decades of unfair treatment leave scars that new policies can’t easily heal. Even good encounters with police can’t erase years of broken trust.
Effects on Black Lives Matter and Social Movements
The Black Lives Matter movement grew stronger as more data revealed enforcement disparities. Video evidence of unequal treatment sparked protests across the UK and beyond.
Activists point to these disparities as proof that policing needs a serious overhaul. Traffic stop data showing Black drivers stopped more often than white drivers for the same behavior backs up their case.
Movements respond by:
- Holding community meetings to share local stories
- Training people to safely record police encounters
They also push for body cameras and more data collection. Demands for independent oversight of police departments keep growing.
These efforts put pressure on leaders to make changes. Activists use statistics on disparities to argue for new funding and training programs.
Media Coverage and Public Perception
News stories about enforcement disparities shape how people think about policing. Reports on unfair stops or searches influence voters and spark policy debates.
News outlets frame these stories differently. Some focus on individual officers. Others highlight broad patterns across entire forces.
Media coverage does a few things:
- Breaking news stories go viral on social media
- Journalists dig into local police data to spot trends
Opinion pieces get experts debating causes and fixes. Residents share personal stories through interviews.
TV coverage hits home with older voters who stick to traditional news. Social media reaches younger people, who share stories and organize protests. This media pressure forces police departments to respond to what’s being uncovered.
Local news can make the difference in whether communities push councils and police chiefs for action.
Disparities in the Criminal Justice System
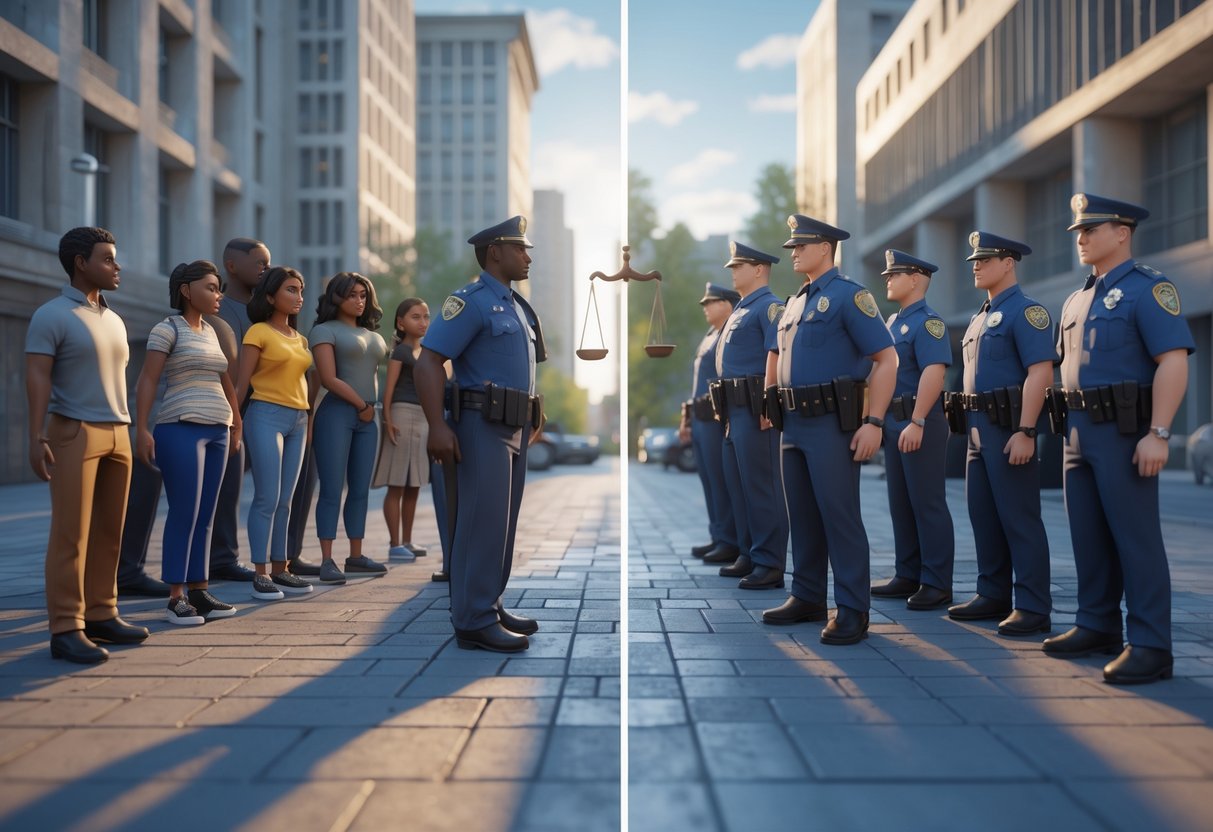
Mass imprisonment hits racial groups unequally, especially Black Americans, who face imprisonment rates nearly five times those of white Americans. The damage stretches well beyond prison walls.
Incarceration Rates and Mass Incarceration
The numbers speak for themselves. Black people make up 14% of the US population but fill 38% of prison cells.
Current Imprisonment Rates by Race:
- Black Americans: 1,240 per 100,000 people
- White Americans: 268 per 100,000 people
- Latino Americans: 349 per 100,000 people
One in five Black men born in 2001 will likely end up in prison at some point. That’s better than decades ago, but still way too high.
The war on drugs drives a lot of this. Black and white Americans use illegal drugs at about the same rates, but Black people get arrested for drug crimes much more often.
Police search Black drivers during stops 6.2% of the time, compared to 3.6% for white drivers. Yet, they find contraband less often among Black drivers.
Long-Term Consequences for Minority Groups
A prison record follows people for decades. Former prisoners struggle to get jobs, housing, and even basic education.
By age 23, nearly half of Black men have been arrested, compared to 38% of white men. Early police contact often leads to bigger problems down the road.
After prison, people face:
- Job discrimination
- Housing restrictions
Losing voting rights and access to benefits makes things even harder.
Families suffer when a breadwinner goes to prison. Kids with incarcerated parents face higher poverty and more behavioral problems.
Communities lose workers and neighbors, weakening social ties and local economies.
The cycle continues—poverty and family struggles raise the risk of more crime. Researchers call this “concentrated disadvantage” in minority neighborhoods.
Discriminatory Policies and Practices
Law enforcement agencies have put policies in place that result in unequal treatment across racial lines. These practices hit communities of color hardest, driving up disparities in police encounters and outcomes.
Stop-and-Frisk Policy
Stop-and-frisk lets officers stop and search people based on “reasonable suspicion.” In practice, it’s shown clear racial bias.
The numbers tell the story:
- Black people get stopped at rates three times higher than white people
- Search rates for Black people hit 20%, while it’s 8% for white people
- Officers actually find contraband less often when searching Black people
This policy concentrates in neighborhoods with lots of minority residents. Officers often use vague reasons like “suspicious movement” or “high-crime area” to justify stops.
Most stops end with no enforcement. That suggests officers use minor offenses as excuses to search certain groups more.
Proactive Policing Methods
Proactive policing means officers go looking for crime instead of just responding to calls. These tactics fall hardest on minority communities.
Common methods include:
- More patrols in certain neighborhoods
- Targeted traffic enforcement
They also focus on quality-of-life violations like loitering or jaywalking, plus warrant sweeps and probation checks.
Departments direct these efforts at areas with more minority residents. More police means more arrests, which then justifies even more policing.
Data shows Black residents are twice as likely to be stopped for “reasonable suspicion” compared to traffic violations. They also get stopped more often for warrants or probation issues.
Addressing Racial Inequality in Enforcement
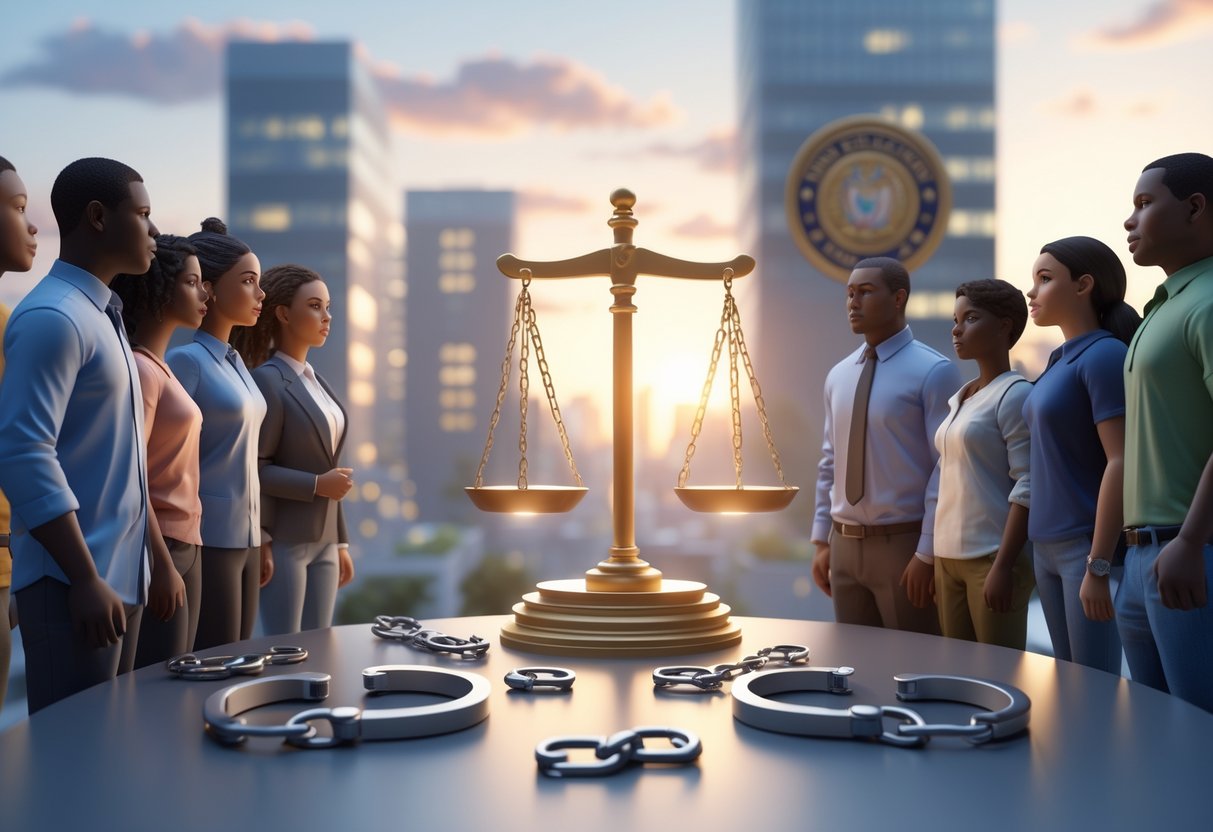
Fixing racial inequality in enforcement takes a three-part plan: change laws and policies that drive unfair outcomes, shift resources toward preventing crime, and give communities more power to solve problems.
Policy Reforms and Legal Changes
Traffic Stop Reforms are a quick win for policymakers. Many agencies now limit pretextual stops—those that use small violations as excuses to investigate bigger crimes. These stops hit Black and Latino drivers the hardest.
Arrest quotas force officers to make stops just to hit numbers, not because of real safety needs. Some states have banned quotas altogether.
Data collection laws require police to track stops by race and publish annual reports. This transparency shines a light on problem areas. Body cameras have become standard in many places to improve accountability.
Court fine reforms keep police budgets from depending on ticket revenue. When departments rely on fines, officers target low-income communities unfairly. New laws separate enforcement from money collection.
Federal oversight through consent decrees steps in when local reform fails. The Department of Justice can force changes in departments with serious problems.
Alternative Approaches to Crime Prevention
Crisis response teams now handle mental health emergencies instead of armed officers. These teams include social workers and medics who know how to de-escalate safely. Cities like Eugene, Oregon have used this model for years.
Drug treatment programs send people to rehab instead of jail. Non-violent offenders get help, not prison time. This approach is cheaper and cuts repeat offenses.
Violence prevention programs focus on people and places most at risk. Community groups find those likely to commit or suffer violence and offer job training, mediation, and support.
Schools are swapping police officers for counselors. Many districts saw that officers led to more suspensions and arrests for normal teen behavior. Alternative discipline keeps kids in class.
Restorative justice brings victims and offenders together to make things right. For many crimes, this works better than traditional punishment. People who try it often feel more satisfied than with court.
Community-Based Solutions
Neighbourhood watch programmes bring residents and police together. They hold regular meetings to spot problems early. When officers know people in the community, trust grows.
Community policing puts officers on foot patrols in certain neighbourhoods. They show up at local events and chat with business owners. This hands-on approach tends to lower both crime and complaints.
Youth programmes offer alternatives to street life. Sports, job training, and mentoring keep young people engaged. The programmes succeed most when locals run them.
Civilian oversight boards handle police misconduct complaints. Community members, not police, serve on these boards. They can recommend discipline and push for policy changes.
Economic development tackles root causes in high-crime areas. Better schools, more jobs, and improved housing help reduce crime conditions. This method takes time and coordination from many groups.
Ongoing Challenges and Resistance
Institutions that benefit from the current system often push back against efforts to fix enforcement disparities. Political fear tactics and police union lobbying keep slowing down progress.
Institutional Barriers to Change
Police departments push back against reforms with structural inertia and old habits. Many still use policies that allow biased enforcement, even when evidence shows clear problems.
Training rarely addresses implicit bias in a meaningful way. Officers get little education on racial disparities in their own ranks.
Union contracts make things tougher. These deals shield officers from consequences and block discipline for biased policing.
Budgets still favour traditional enforcement over community programmes. Cities have a hard time moving money into violence prevention or mental health services.
Departments often skip proper data collection. Without good tracking, they dodge responsibility for unfair outcomes.
When leadership changes, reform efforts get disrupted. New administrators sometimes drop past initiatives or just don’t care as much about change.
Resistance and Backlash in Reform Efforts
Political opposition has ramped up after recent reform attempts. Some politicians use public safety fears to reverse progress on enforcement disparities.
You’ll see headlines like “safety concerns have led many school districts to place officers back on campuses” and “a return to policing low-level ‘crimes of poverty.’”
Media coverage doesn’t help either. Sensational crime stories build public pressure for tougher policing.
Police unions fight reforms at every step. They take new policies to court and write contracts that keep discriminatory practices in place.
Sometimes, even communities resist. Some residents call for more enforcement, even when it doesn’t really work.
Crime spikes during the pandemic have given critics more fuel. Reform advocates get accused of putting ideology ahead of public safety.
Case Studies and Notable Examples

Investigations and policy changes keep showing the same patterns: enforcement affects communities differently. Big incidents like George Floyd’s death have triggered federal probes, and some cities are trying new things to cut down on bias.
High-Profile Incidents of Racial Disparities
George Floyd’s death in Minneapolis set off global protests and drew federal attention. A white officer held Floyd’s neck down for 9½ minutes, ignoring his pleas of “I can’t breathe.”
The Justice Department found Minneapolis police regularly used excessive force and discrimination. They now have to follow a consent decree and independent monitoring.
Other major cases:
-
Phoenix, Arizona: Officers aimed guns at an unarmed Black family accused of shoplifting. Federal investigators found illegal arrests of homeless people and unnecessary deadly force against Black, Hispanic, and Native American residents.
-
Memphis, Tennessee: Tyre Nichols died after police beat him, exposing a pattern of excessive force against Black residents—even in a mostly Black city.
-
Louisville, Kentucky: Police killed Breonna Taylor during a 2020 raid. Investigators found they didn’t follow proper procedure for search warrants.
Since April 2021, the Justice Department has opened 12 similar investigations. Every completed case found illegal police practices.
Lessons from Recent Policy Trials
Traffic stop reforms are showing some promise. Stops are the most common police encounter and often escalate, especially for Black and Latino drivers.
Key reform strategies:
| Reform Type | Example | Impact |
|---|---|---|
| Data collection | Recording race in all stops | Pinpoints problem areas |
| Training programmes | Bias awareness courses | Cuts down on discriminatory stops |
| Policy changes | Limiting pretextual stops | Fewer pointless encounters |
Trenton, New Jersey shut down two street units that violated rights. Now, the city focuses on community policing instead of aggressive tactics.
Some departments use benchmark data to track progress:
- Stop rates by neighbourhood demographics
- Search success rates by race
- Use of force incidents during stops
California’s review of 15 major police departments found big differences in how officers treat Black and white civilians. This data helps departments spot who needs more training.
Our Team and Commitment to Equity

Our team includes advocates, data scientists, community organisers, and former officers. We team up with policymakers and researchers to develop evidence-based solutions for enforcement disparities.
Collaborations with Policymakers and Researchers
We work with police departments and government agencies to dig into enforcement data and spot racial disparities. Our project with the Denver Police Department built the first national database to track police behaviour.
That partnership led to real changes in Denver’s discipline policies. We helped make their training programmes more transparent and accountable.
Our research partnerships:
- National Justice Database creation
- Justice Navigator interactive tool
- Policy review and recommendations
- Training programme design
We join researchers to study traffic stops, arrests, and sentencing trends. Our data analysis highlights where disparities crop up most.
Lawmakers use our findings to shape new laws. We give them solid evidence on which enforcement practices lead to unfair outcomes.
Supporting Lasting Change in Law Enforcement
We measure how new policing alternatives affect real communities. Our team checks if policy changes actually shrink disparities over time.
Our support includes:
- Training officers to recognise bias
- Setting up data collection systems
- Regularly analysing enforcement trends
- Helping communities engage with police
We help departments adjust hiring and promotion. Our advice pushes for more diverse leadership.
Our tools make police data more transparent for everyone. Communities can track if their local departments are making progress on equity.
We also help departments rethink their budgets. This makes sure resources go to programmes that actually reduce disparities.
Frequently Asked Questions
Enforcement disparities hit communities differently depending on race, ethnicity, and income. Here are some questions about what causes these gaps and what’s being done.
What factors contribute to racial disparities in policing?
A few big factors drive racial disparities in law enforcement. Historical discrimination and exclusion built in systemic biases that still shape policing.
Implicit bias matters too. Officers sometimes unconsciously connect certain racial groups with crime, even if they don’t mean to.
Policy choices play a role. Stop-and-frisk and similar practices target Black and Hispanic drivers more. Drug enforcement focuses on street-level crimes in minority communities.
Many officers don’t get enough training to spot their own biases. Departments often skip proper de-escalation training that could prevent bad encounters.
Police tend to concentrate in certain neighbourhoods. That means more contact—and more risk—for minority residents.
Can you give examples of how inequality manifests in the justice system?
Drug arrests highlight racial gaps in both the UK and US. Black people get arrested 3.6 times more than white people for cannabis, even though usage rates are about the same.
School discipline shows early warning signs. Students of colour get suspended and sent to police more often than white students.
Traffic stops reveal everyday bias. Black drivers get pulled over more for minor things like equipment checks.
Deadly force stats are grim. Black people are twice as likely as white people to be unarmed when police kill them.
Housing enforcement creates more hurdles. Policies that look neutral on paper can hit protected groups much harder.
How do statistics reflect racial and ethnic disparities in the criminal justice system?
Arrest numbers show big gaps. In 2019, police made over a million drug arrests—Black people made up 29% of those, but only 14% of the population.
Prison stats are even starker. Black and Hispanic people get longer sentences than white people for the same crimes.
Police shooting data reveals bias too. Research shows officers are more likely to shoot unarmed Black suspects than white ones.
Traffic stop data keeps showing unequal treatment. Black drivers get searched more, even though police find less contraband.
Juvenile justice stats show early disparities. Youth of colour get pulled into the system more and face tougher penalties.
In what ways does the relationship between police and minorities exhibit disparities?
Trust between police and minority communities remains low. Years of biased enforcement have damaged relationships and trust.
Use of force incidents often involve minority suspects. Black people face higher rates of brutality and excessive force.
Community policing has mixed results. Some neighbourhoods get positive engagement, while others mostly see enforcement.
Response times and service quality aren’t consistent. Minority neighbourhoods often wait longer and get less thorough investigations.
Officer diversity doesn’t match the communities served. Many departments still lack representation from local residents.
What are the long-term impacts of racial disparities within law enforcement stops?
Biased enforcement leads to criminal records that block jobs, housing, and education for years. Even minor violations can haunt people for decades.
When residents get treated unfairly, trust in police falls apart. That makes solving crimes harder—witnesses don’t want to cooperate.
Fines, court costs, and lost work hit families hard. A simple traffic stop can spiral into big financial trouble for low-income families.
Mental health suffers too. Communities experience more anxiety and trauma, and kids who see biased policing may grow up fearing police.
School arrests for minor issues disrupt education. These encounters can knock students off track for good.
How are efforts to address racial disparities in the criminal justice system evolving?
Training programs these days put more emphasis on recognizing implicit bias. Instructors also spend more time on de-escalation techniques.
Some departments say they’ve seen better results after rolling out thorough bias training. It’s not perfect, but there’s a sense that things might be moving in the right direction.
Policy reforms now limit how much discretion officers have in certain scenarios. Cutting down on non-safety traffic stops seems to reduce some harmful encounters.
Agencies collect more data to spot problems and see if things are actually improving. They’re tracking stop patterns and use of force numbers by race and ethnicity.
Community oversight boards step in to hold police departments accountable from the outside. These groups review complaints and suggest changes to policy.
Some cities send mental health professionals—rather than police—when people are in crisis. This move often leads to fewer arrests for folks dealing with behavioral health issues.
Departments also lean on technology to watch for bias in enforcement. Body cameras and data analysis tools help them catch troubling trends before they get worse.

